“Data Visualization helps in understanding your business trends with interactive graphical representation”
Data Visualization is a process of taking data and placing it into a visual context. Trends, correlations, and patterns that might not be noticed in text-based data can be recognized easily by using data visualization tools.
Data analysis is key to the success of any enterprises. It gives the power to make informed decisions and calculated risks. However, for most organizations, analyzing terabytes of data and understanding the trends is very difficult without proper graphical interactive Visualization.
At Centroxy, we help our customers in developing visualization solutions from scratch and even help them solve problems in their existing data visualization solutions.
Data Visualization Challenges Solved by Us
1. Overloaded dashboards and reports:
When too many visual elements, colors, or data visualization types are used in creating dashboards and reports, it becomes difficult to understand the data. Therefore, we make sure that the trends are recognized immediately, chart types are consistent, and the colors are relevant.
2. Insufficient flexibility:
Our data visualization services cover the development and design of clear-cut dashboards for desktop as well as mobile users. We even solve data security challenges for our clients and deliver a unique UI/UX design.
3. Disregarded user role:
We tailor dashboards and reports that help our users to focus on the relevant data.
4. Not insightful reports:
We help our clients in making informed decisions in spite of wasting their time in searching for insights. Therefore, we consider data visualization as an indispensable part of the data reporting process.
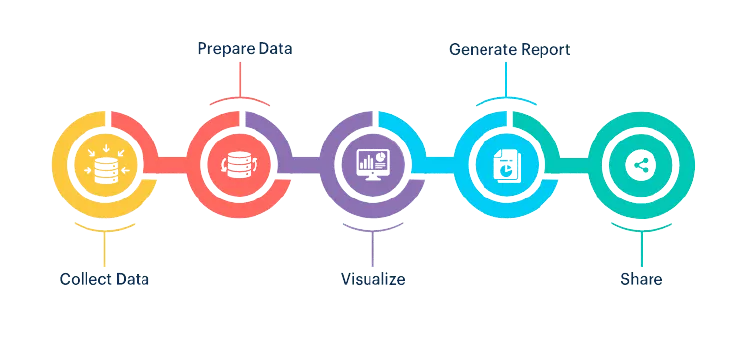
Data Visualization Process

At Centroxy, we have a team of expert business analysts and data scientists to help you build data visualization on your ever-changing data. Our experts are well versed with different data visualization tools to help the customer create graphical interactive data representations.

Tools & technologies used by us
- Microsoft Power BI
- Tableau Public
- Microsoft PowerPivot
- Microsoft Excel
- QlikView
- IBM Cognos
- Sisense
- DOMO
Benefits 0f Data Visualization
- Rapid Identification of Latest Trends
- Access to Actionable Items
- Quick Access to Relevant Business Insights
Centroxy provides state of the art, integrated, secured Data Management services offering Data Warehouse Service, Data Extraction Service, Data Visualization Service, and Data Analysis Service using industry best practices. It includes advisory, implementation and support services with Centroxy’s certified and experienced team.
Streamline your data visualization process
Find out more about how we can help your organization in implementing data visualization service.
Let us know your areas of interest so that we can serve you better.
